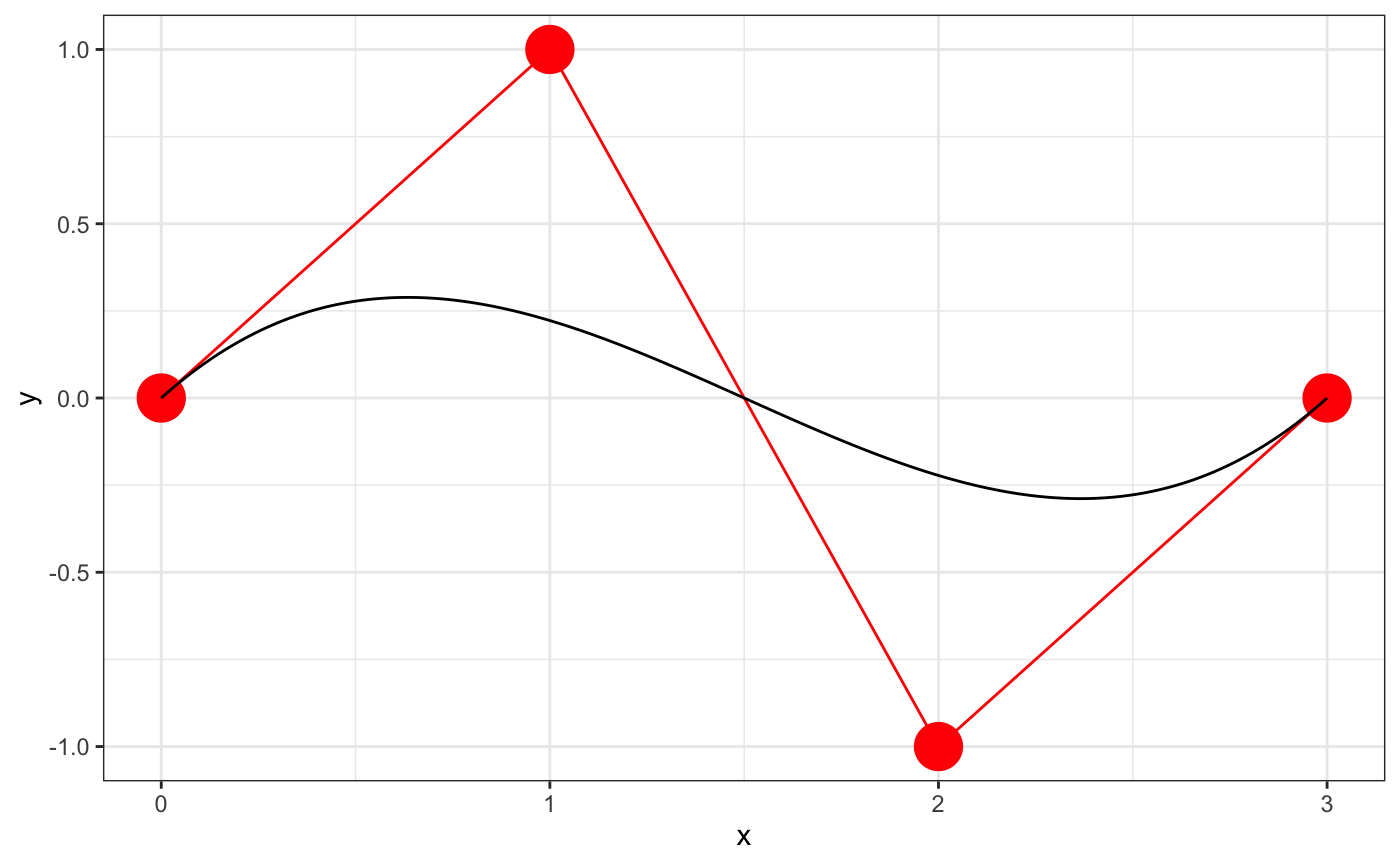
Compute the Bezier function of a collection of polynomials. By Bezier function we mean the Bezier curve function, a parametric map running from t = 0, the first point, to t = 1, the last point, where the coordinate mappings are linear combinations of Bernstein polynomials.
bezier_function(points, weights = rep(1L, nrow(points)))

bezierFunction(...)
Arguments
| points | a matrix or data frame of numerics. the rows represent points. |
|---|---|
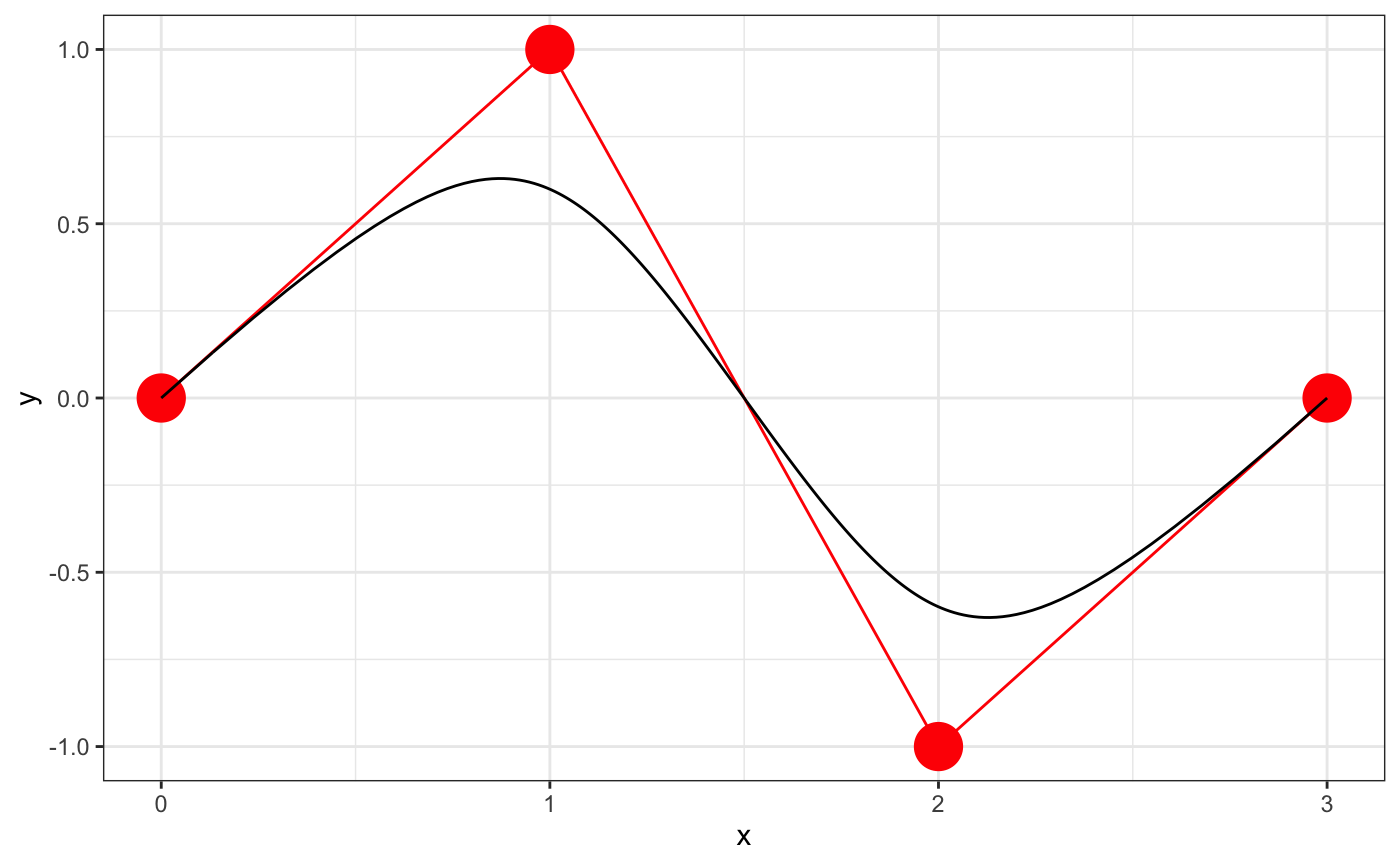
| weights | the weights in a weighted Bezier curve |
| ... | ...; used internally |
Value
function of a single parameter
Details
The function returned is vectorized and evaluates the Bezier curve in a numerically stable way with de Castlejau's algorithm (implemented in R).
References
http://en.wikipedia.org/wiki/Bezier_curve, http://en.wikipedia.org/wiki/De_Casteljau's_algorithm
See also
Examples
library(ggplot2); theme_set(theme_bw()) t <- seq(0, 1, length.out = 201) points <- data.frame(x = 0:3, y = c(0,1,-1,0)) f <- bezier_function(points) df <- as.data.frame(f(t)) ggplot(aes(x = x, y = y), data = df) + geom_point(data = points, color = "red", size = 8) + geom_path(data = points, color = "red") + geom_path()f <- bezier_function(points, weights = c(1,5,5,1)) df <- as.data.frame(f(t)) ggplot(aes(x = x, y = y), data = df) + geom_point(data = points, color = "red", size = 8) + geom_path(data = points, color = "red") + geom_path()f <- bezier_function(points, weights = c(1,10,10,1)) df <- as.data.frame(f(t)) ggplot(aes(x = x, y = y), data = df) + geom_point(data = points, color = "red", size = 8) + geom_path(data = points, color = "red") + geom_path()