Compute the Bezier polynomials of a given collection of points. Note that
using mpoly::as.function.mpoly() on the resulting Bezier polynomials is
made numerically stable by taking advantage of de Casteljau's algorithm; it
does not use the polynomial that is printed to the screen. See
bezier_function() for details.
bezier(..., indeterminate = "t")
Arguments
| ... | either a sequence of points or a matrix/data frame of points, see examples |
|---|---|
| indeterminate | the indeterminate of the resulting polynomial |
Value
a mpoly object
See also
Examples
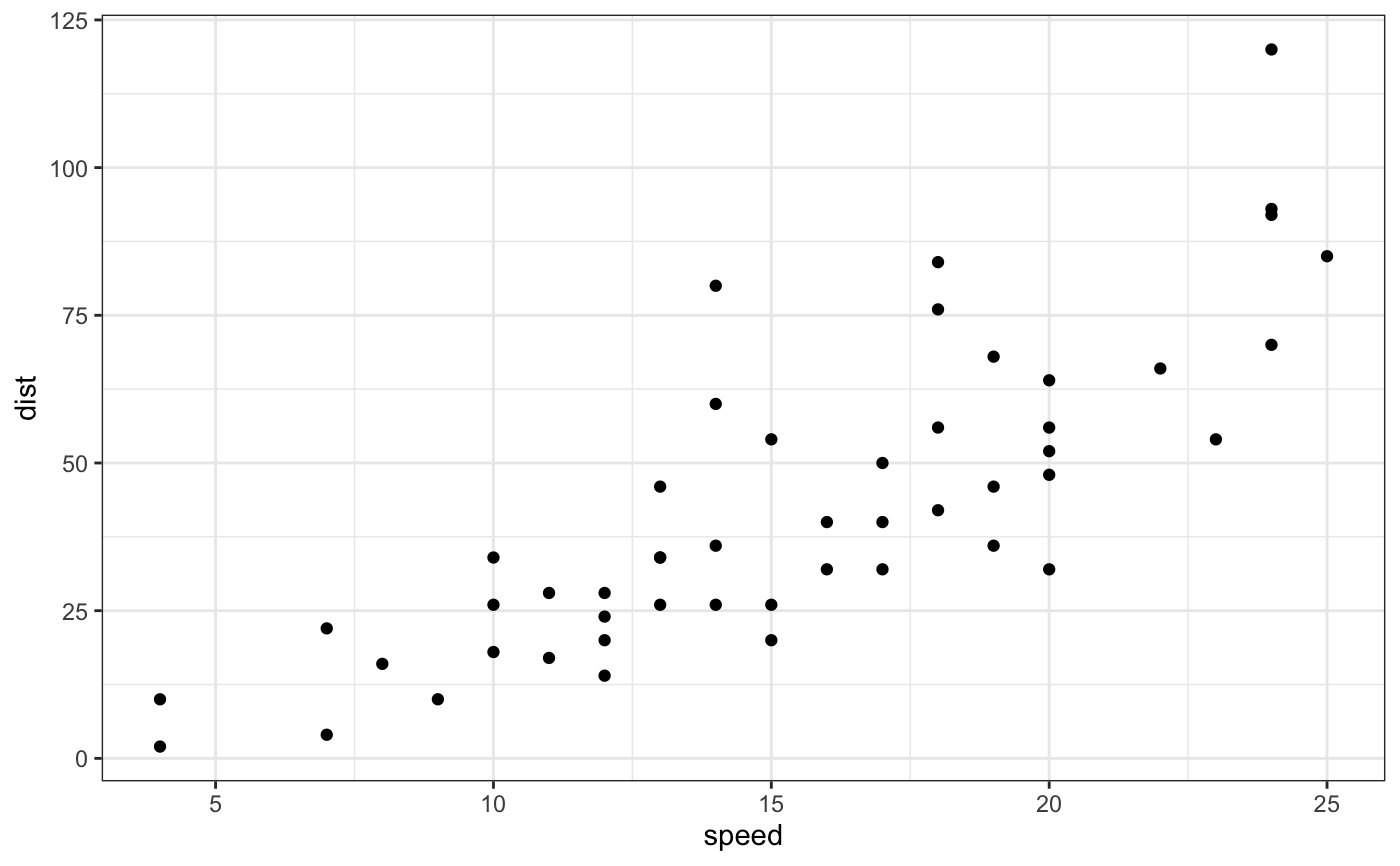
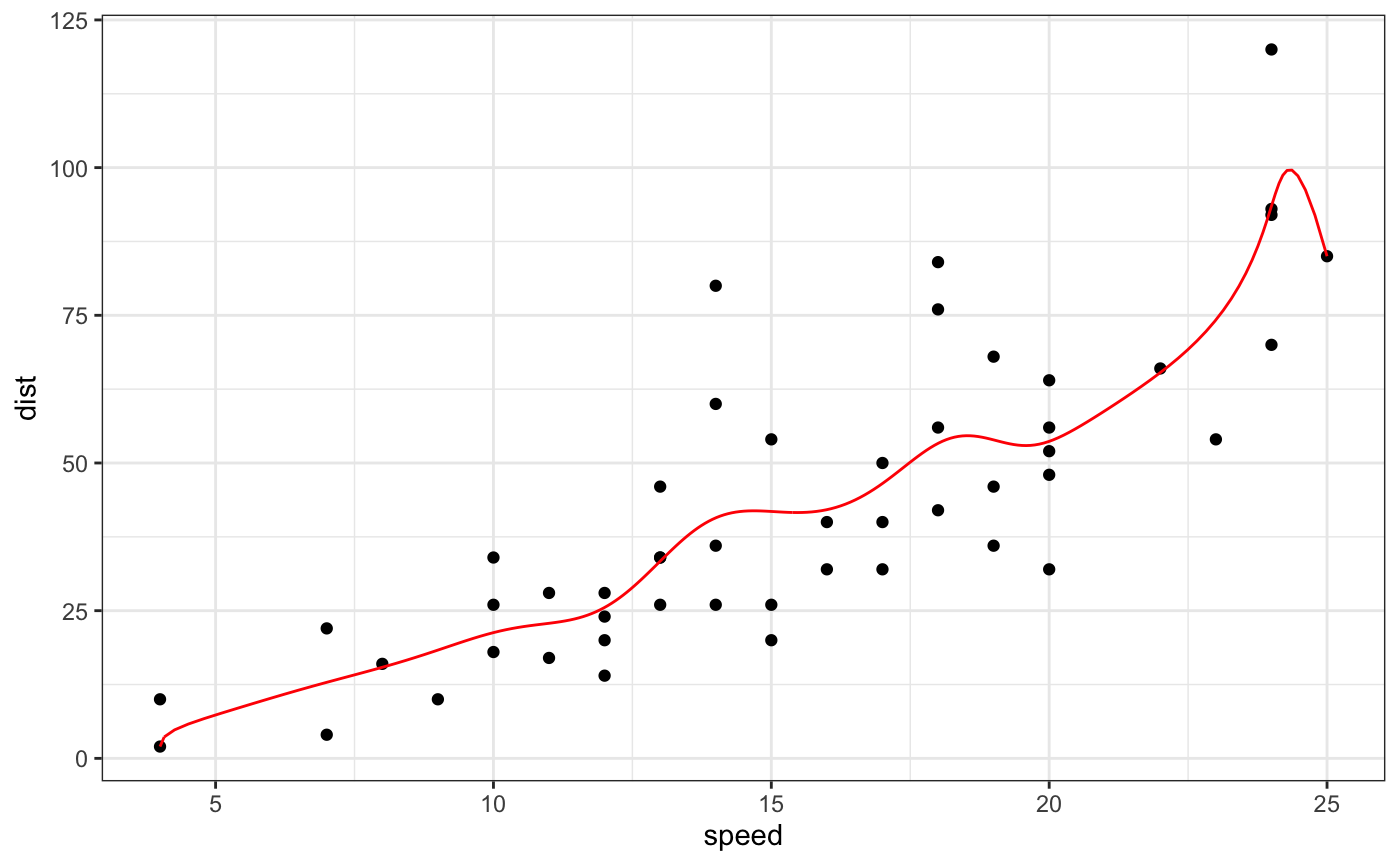
#> Error in FUN(X[[i]], ...): object 'p1' not found#> Error in 0:(n - 1): argument of length 0#> Error in 0:(n - 1): argument of length 0# visualize the bernstein polynomials library(ggplot2); theme_set(theme_bw()) s <- seq(0, 1, length.out = 101) ## example 1 points <- data.frame(x = 0:3, y = c(0,1,-1,0)) (bezPolys <- bezier(points))#> Error in 0:(n - 1): argument of length 0#> Error in as.function(bezPolys): object 'bezPolys' not found#> Error in f(s): could not find function "f"ggplot(aes(x = x, y = y), data = df) + geom_point(data = points, color = "red") + geom_path(data = points, color = "red") + geom_path()#> Error: You're passing a function as global data. #> Have you misspelled the `data` argument in `ggplot()`#> Error in as.function(bezPolys, weights = c(1, 5, 5, 1)): object 'bezPolys' not found#> Error in f(s): could not find function "f"ggplot(aes(x = x, y = y), data = df) + geom_point(data = points, color = "red") + geom_path(data = points, color = "red") + geom_path()#> Error: You're passing a function as global data. #> Have you misspelled the `data` argument in `ggplot()`#> Error in 0:(n - 1): argument of length 0#> Error in as.function(bezPolys): object 'bezPolys' not found#> Error in f(s): could not find function "f"ggplot(aes(x = x, y = y), data = df) + geom_point(data = points, color = "red") + geom_path(data = points, color = "red") + geom_path()#> Error: You're passing a function as global data. #> Have you misspelled the `data` argument in `ggplot()`#> Error in 0:(n - 1): argument of length 0#> Error in as.function(bezPolys): object 'bezPolys' not found#> Error in f(s): could not find function "f"ggplot(aes(x = x, y = y), data = df) + geom_point(data = points, color = "red") + geom_path(data = points, color = "red") + geom_path()#> Error: You're passing a function as global data. #> Have you misspelled the `data` argument in `ggplot()`#> Error in 0:(n - 1): argument of length 0#> Error in as.function(bezPolys): object 'bezPolys' not found#> Error in f(s): could not find function "f"ggplot(aes(x = x, y = y), data = df) + geom_point(data = points, color = "red") + geom_path(data = points, color = "red") + geom_path()#> Error: You're passing a function as global data. #> Have you misspelled the `data` argument in `ggplot()`s <- seq(0, 1, length.out = 201) p <- bezier(cars) f <- as.function(p) df <- as.data.frame(f(s)) qplot(speed, dist, data = cars) + geom_path(data = df, color = "red")# the curve is not invariant to permutations of the points # but it always goes through the first and last points permute_rows <- function(df) df[sample(nrow(df)),] p <- bezier(permute_rows(cars))#> Error in permute_rows(cars): could not find function "permute_rows"f <- as.function(p) df <- as.data.frame(f(s)) qplot(speed, dist, data = cars) + geom_path(data = df, color = "red")