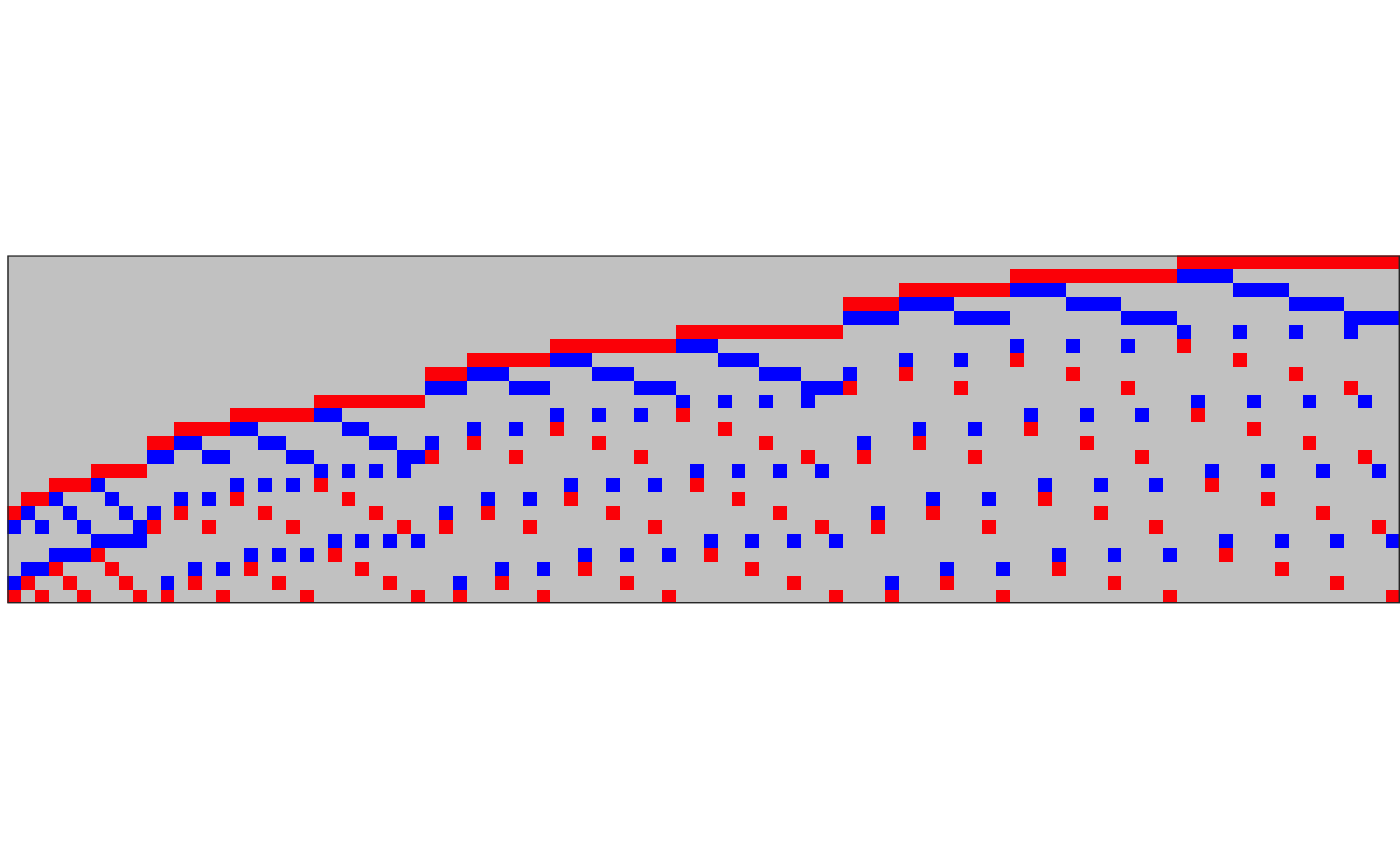
plot_matrix is a R variant of Matlab's spy function.
plot_matrix(A)
Arguments
| A | A matrix |
|---|
Value
a ggplot object
Examples
#> [,1] [,2] [,3] [,4] [,5] [,6] [,7] [,8] [,9] #> [1,] 1 0 0 1 0 0 1 0 0 #> [2,] 1 0 0 1 0 0 1 0 0 #> [3,] 1 0 0 1 0 0 1 0 0 #> [4,] 0 1 0 0 1 0 0 1 0 #> [5,] 0 1 0 0 1 0 0 1 0 #> [6,] 0 1 0 0 1 0 0 1 0 #> [7,] 0 0 1 0 0 1 0 0 1 #> [8,] 0 0 1 0 0 1 0 0 1 #> [9,] 0 0 1 0 0 1 0 0 1plot_matrix(A)if (has_4ti2()) { plot_matrix(markov(A)) (A <- genmodel(c(2L, 2L), list(1L, 2L))) plot_matrix(A) plot_matrix(markov(A)) (A <- genmodel(c(5L, 5L), list(1L, 2L))) plot_matrix(A) plot_matrix(markov(A)) }#> Warning: WARNING: Overflow detection is not available on this architecture/compiler. #> WARNING: To guarantee correct results, run 4ti2 with arbitrary precision #> WARNING: by using the option `-parb'#> Warning: WARNING: Overflow detection is not available on this architecture/compiler. #> WARNING: To guarantee correct results, run 4ti2 with arbitrary precision #> WARNING: by using the option `-parb'#> Warning: WARNING: Overflow detection is not available on this architecture/compiler. #> WARNING: To guarantee correct results, run 4ti2 with arbitrary precision #> WARNING: by using the option `-parb'

