This is a wrapper for deriv.mpoly.
gradient(mpoly)
Arguments
| mpoly | an object of class mpoly |
|---|
Value
An object of class mpoly or mpolyList.
See also
Examples
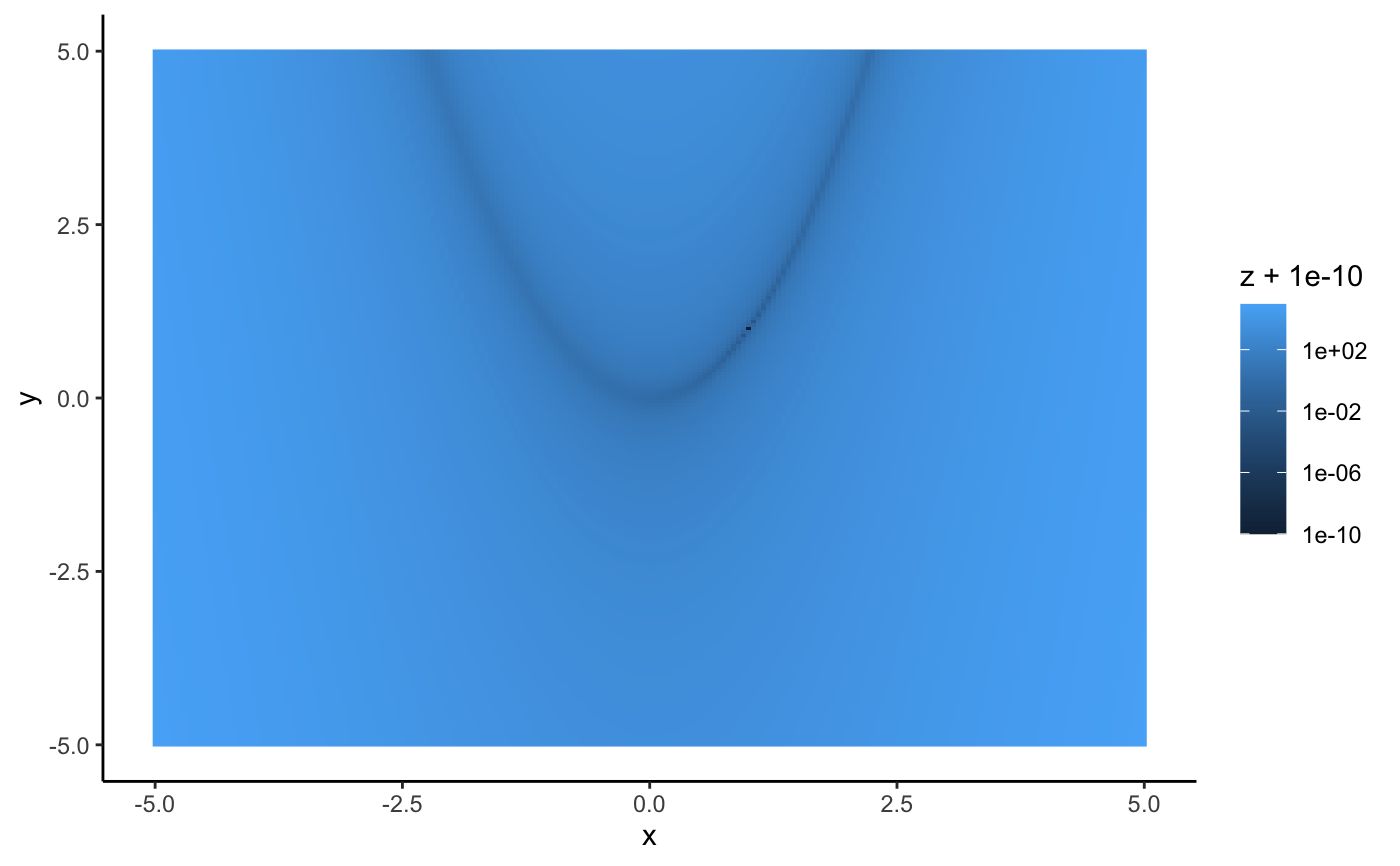
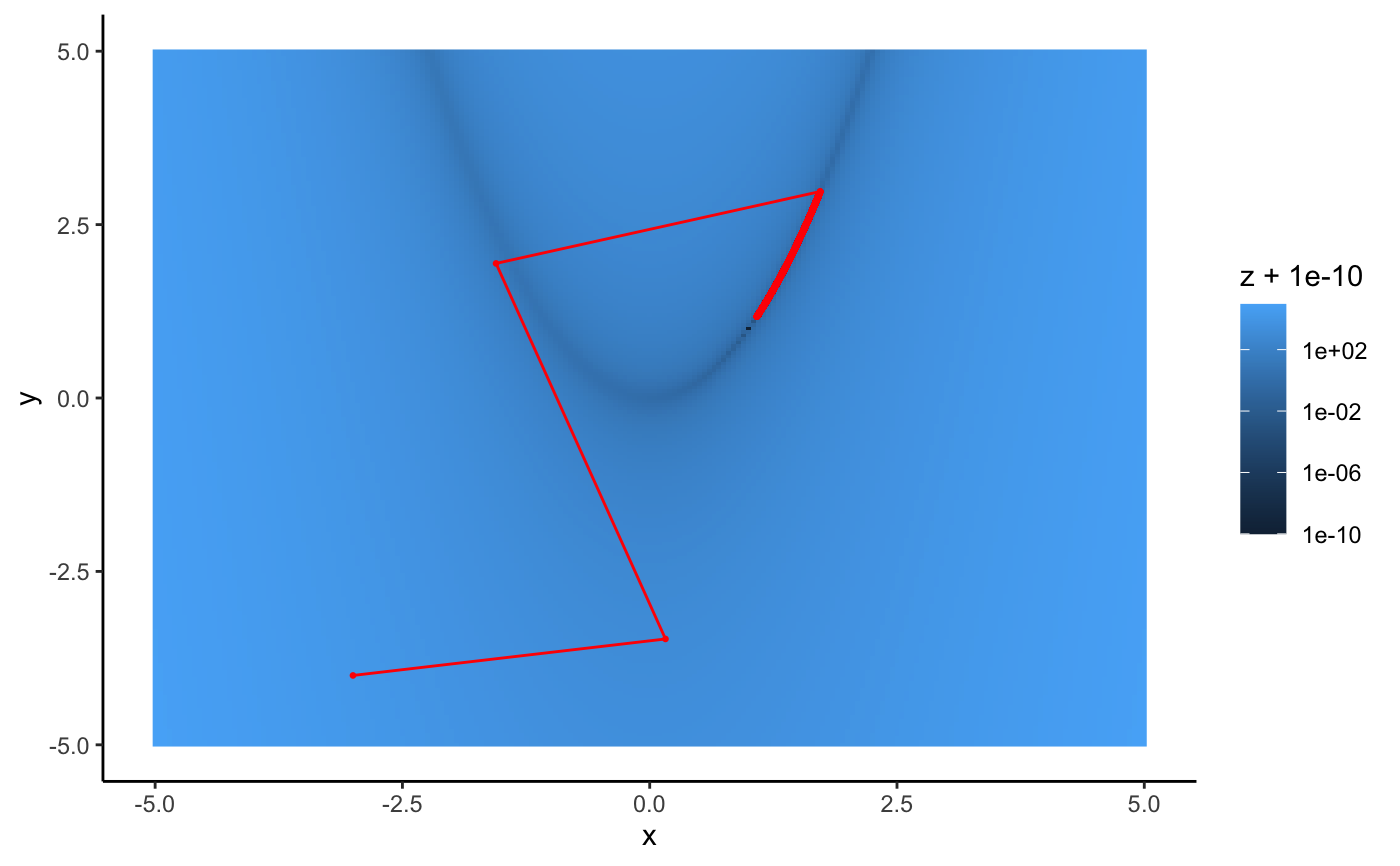
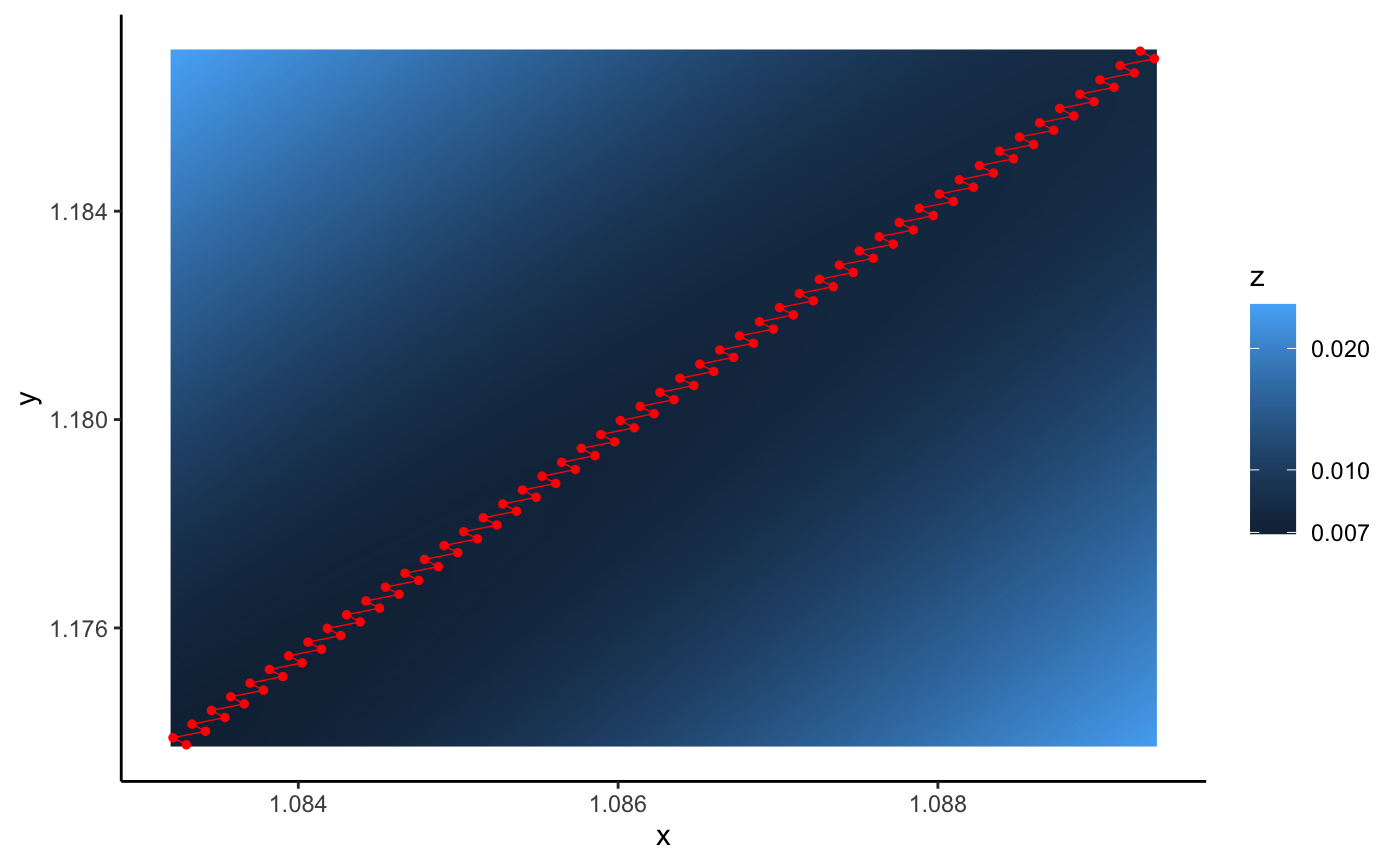
#> y #> x + z #> y + 2 z# gradient descent illustration using the symbolically # computed gradient of the rosenbrock function (shifted) rosenbrock <- mp("(1 - x)^2 + 100 (y - x^2)^2") fn <- as.function(rosenbrock)#>(rosenbrock_gradient <- gradient(rosenbrock))#> 400 x^3 - 400 x y + 2 x - 2 #> -200 x^2 + 200 y#># visualize the function library(ggplot2) s <- seq(-5, 5, .05) df <- expand.grid(x = s, y = s) df$z <- apply(df, 1, fn) ggplot(df, aes(x = x, y = y)) + geom_raster(aes(fill = z + 1e-10)) + scale_fill_continuous(trans = "log10")# run the gradient descent algorithm using line-search # step sizes computed with optimize() current <- steps <- c(-3,-4) change <- 1 tol <- 1e-5 while(change > tol){ last <- current delta <- optimize( function(delta) fn(current - delta*gr(current)), interval = c(1e-10, .1) )$minimum current <- current - delta*gr(current) steps <- unname(rbind(steps, current)) change <- abs(fn(current) - fn(last)) } steps <- as.data.frame(steps) names(steps) <- c("x", "y") # visualize steps, note the optim at c(1,1) # the routine took 5748 steps ggplot(df, aes(x = x, y = y)) + geom_raster(aes(fill = z + 1e-10)) + geom_path(data = steps, color = "red") + geom_point(data = steps, color = "red", size = .5) + scale_fill_continuous(trans = "log10")# it gets to the general region of space quickly # but once it gets on the right arc, it's terrible # here's what the end game looks like last_steps <- tail(steps, 100) rngx <- range(last_steps$x); sx <- seq(rngx[1], rngx[2], length.out = 201) rngy <- range(last_steps$y); sy <- seq(rngy[1], rngy[2], length.out = 201) df <- expand.grid(x = sx, y = sy) df$z <- apply(df, 1, fn) ggplot(df, aes(x = x, y = y)) + geom_raster(aes(fill = z)) + geom_path(data = last_steps, color = "red", size = .25) + geom_point(data = last_steps, color = "red", size = 1) + scale_fill_continuous(trans = "log10")